Getting started with Klocwork Desktop for C/C++
Klocwork Desktop is a GUI alternative to the command-line desktop analysis tool, kwcheck. Like kwcheck, Klocwork Desktop is for developers using IDEs and text editors that aren't supported in the form of an IDE plugin.
If you access your source code and compilers remotely, use Klocwork Desktop in remote mode.
Getting the workflow right
kwgcheck and kwcheck work together to help you set up your build analysis.
kwgcheck provides a handy GUI (Klocwork Desktop) that you can use to set up and configure your projects, though it will likely be necessary to run kwcheck from the command line as you configure your analysis build. When you go back to the command line from the GUI, you can minimize Klocwork Desktop to the system tray (see Tips and tricks for Klocwork Desktop for instructions). Continue capturing your build settings in the console by running make and by running kwcheck to analyze the results of your build. As your analysis detects new defects, the defects will be reported by the kwgcheck tool. You will see notifications in the system tray as well. Any files that are opened outside of the command line will be analyzed as part of the build.
It's a good idea to follow this workflow to ensure that your kwgcheck instance is always accurate and up to date.
Set up a local project
For each coherent, buildable component that you work on, create a local project -- a repository for your analysis results and settings. You need to set up a project only once for each component you work on.
You get the most from static code analysis when you connect a small local project to a larger project on the Klocwork Server. The small local project is analyzed quickly while incorporating Klocwork knowledge bases generated on the server where additional source files were analyzed (for example, shared libraries). Connecting to a server project also allows you to share issue status information with the integration build analysis and among team members. You can run a standalone desktop analysis, but the analysis only derives knowledge from the local project's source files.
You perform this step only once for each project.
Project setup includes capturing build settings. Klocwork uses a build specification to perform an analysis. The build specification contains a list of the project's source files and their compiler options (includes and defines).
- From the command line, run kwgcheck or use the desktop shortcut.
- From the toolbar, click
 .
. - Enter a name for your project.
- If desired, specify a location for your project. By default, Klocwork creates the project in <home_directory>/klocwork_projects/<project_name>. Make sure the location you choose has sufficient storage space, because the project can become large over time.
- In the Type section, Connected project is automatically selected.
- Enter the Klocwork Server host and port information if required and click Next.
- In the Server project name list, select the server project to connect to.
- Enable the Use secure connection checkbox if a secure connection to the Klocwork Server has been set up.
- Click Next.
- The Build Settings dialog appears. Klocwork uses a build specification to perform an analysis. The build specification contains a list of the project's source files and their compiler options (includes and defines).
- If you see the message: "The project has no build settings", continue to the next section.
- If you see the message: "Configure build specification variables", go to Configure build specification variables - Klocwork Desktop.
- If you don't see either message, you're using a build specification template, and no template variables need to be set. Continue to Continuous analysis when you open files.
Capture your build settings with kwshell
This section does not apply if you use a build specification template.
- From your source directory, start kwshell with the -pd option. For example:
kwshell -pd /space/testing/jlee/myproject/.kwlp
When kwshell starts, it indicates which Klocwork local project directory (.kwlp) it's using. For example:
Using Klocwork project directory '/space/testing/jlee/myproject/.kwlp'
Running Klocwork Shell ...
A [kw] prefix is also added to the command-line prompt to indicate that kwshell is running.
- Then, build your component. For example:
make
Continuous analysis when you open files
Continuous analysis provides automatic issue detection and error highlighting while you work. Watch a demo.
Double-click a file in the Project Navigator to open it in the viewer and launch the analysis. Detected issues are highlighted in the viewer.
Tips:
- In connected desktop projects, local issues are those you've introduced since the last integration build analysis; system issues are those that also exist in the integration build.
- From time to time, you may want to analyze an entire component. To do this, create a working set.
Continuous analysis on an entire project
By default, Klocwork Desktop performs continuous analysis on only those files that are currently open. You can configure Klocwork Desktop to perform continuous analysis on the entire project. As you use Klocwork Desktop, the project folder is scanned and analysis is performed on any modified file regardless of whether or not the file is currently open.
To enable continuous analysis on an entire project:
- Click Tools > Preferences.
- On the Preferences dialog, under Analysis Options, select Enable continuous analysis of the project.
- Set the scan interval. The scan interval defines how often the project source will be scanned for modified files.
- Set the quiet period. The quiet period defines the amount of time that elapses after a modified file is detected (during a scan), but before an analysis is performed. The quiet period delays analysis during SCM updates or other bulk changes to ensure that all changed files are discovered and subsequently scheduled for analysis.
- Select Run analysis on startup to enable continuous analysis of the project on startup.Select this option to ensure that modifications to your project source that occur between Klocwork Desktop sessions are discovered. It's a good idea to select this option when performing incremental build analysis.
- Click OK to save the changes.
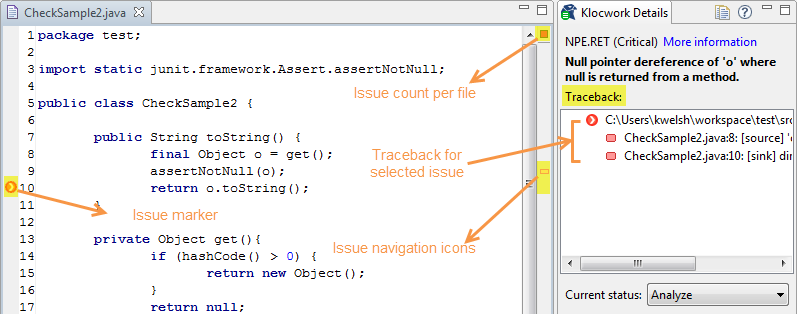
Investigate detected issues
- Click a navigation icon on the right to locate the issue in the file.
An issue marker appears on the left, and traceback information for the selected issue appears in the Klocwork Details view on the right.
- Use traceback information to investigate the issue. Traceback lines link to events that contributed to the issue you're viewing.
- To get more information about an issue, right-click the issue in the Klocwork issues view and select More information.
Fix defects and ignore the rest
For a real defect:
- Fix the issue in your code and save your changes.
- The analysis runs again.
If the issue disappears from the list, it's fixed.
For an issue that doesn't need to be fixed:
- Right-click the issue in the list and select Change Status > Ignore.
- Enter a comment and click OK.
If you're connected to a project on the Klocwork Server, your changes are now visible to other developers, and in Validate. Your desktop project is also updated with any changes made by other developers. This happens even before another integration build analysis has been run.
Before you check in
- Use Klocwork Refactoring to improve your code design